Key Features of ndCurveMaster
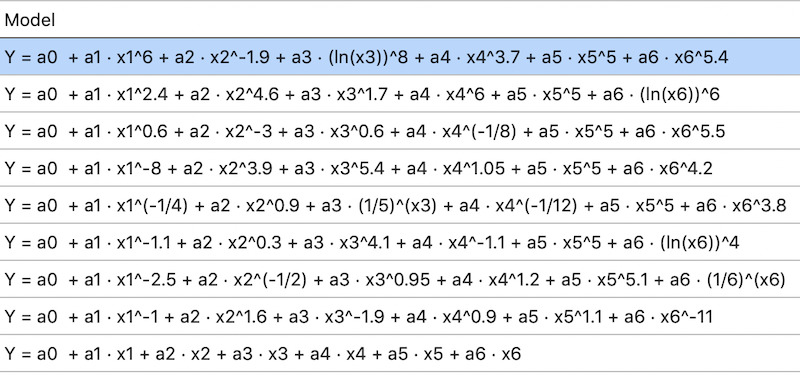
ndCurveMaster automatically creates multiple alternative nonlinear regression models — quickly, smartly, and without coding.

Models can include just a few predictors or advanced variable combinations, for example:
- Simple nonlinear model:
Y = a0 + a1 · exp(x1)-0.5 + a2 · (ln(x2))8 + a3 · exp(x3)1.5 + a4 · x44.1 + a5 · x55 + a6 · x66 - Model with variable combinations:
Y = a0 + a1 · exp(x1)-0.1 + a2 · x2 + a3 · x3 + a4 · x4(1/8) + a5 · x10.9 · x20.9 + a6 · x11.35 · x3 + a7 · (ln(x1))5 · ln(x4) + a8 · x2 · x3 + a9 · (ln(x3))8 · x40.55 + a10 · x11.25 · x2 · x3 + a11 · x2(1/2) · x36 · x40.8 - High-order polynomial model:
Y = a0 + a1 · x1 + a2 · x2 + a3 · x3 + a4 · x1 · x2 + a5 · x1 · x3 + a6 · x2 · x3 + a7 · x1 · x2 · x3 + a8 · x12 + a9 · x22 + a10 · x32 + a11 · x13 + a12 · x23 + a13 · x33 + a14 · x12 · x2 + a15 · x1 · x22 + a16 · x12 · x3 + a17 · x1 · x32 + a18 · x2 · x32 + a19 · x22 · x3 + a20 · x12 · x2 · x3 + a21 · x1 · x22 · x3 + a22 · x1 · x2 · x32
After model generation, ndCurveMaster evaluates their quality using:
- Fit statistics: R Square, Adjusted R Square, Pearson's R, Standard Error, RRMSE, RMSE for training and test sets
- Variance analysis (ANOVA)
- t-statistics and confidence intervals
- Normality checks with Q-Q plots and tests (Shapiro-Wilk, Anderson-Darling)
Learn more about residual normality - Variable sensitivity analysis (when residuals are not normal)
Learn more about sensitivity analysis - Multicollinearity detection via VIF and Pearson Correlation Matrix
Learn more about multicollinearity - Overfitting detection using cross-validation
Learn more about overfitting detection - Visual checks of heteroscedasticity with residual plots
Model search is powered by heuristic and randomized methods.
Learn more about model search algorithms
During the search, you can:
- Set a maximum acceptable level of multicollinearity (VIF)
- Limit model overfitting
- Specify the minimum value of regression coefficients
- Lock specific predictors to keep them unchanged
- Speed up the process by restricting to basic functions, and run a full search later
ndCurveMaster uses up to 380 built-in base functions (power, exponential, logarithmic, trigonometric), organized in 5 collections, plus your own custom formulas.
Full Summary of Features
- Fully automated search and fitting of nonlinear regression models
- Evaluation of models with R Square, Adjusted R Square, RMSE, Standard Error, RRMSE
- Normality testing of residuals (Shapiro-Wilk, Anderson-Darling) and Q-Q plot
- Variable sensitivity analysis for non-normal residuals
- Detection and prevention of overfitting using cross-validation
- Multicollinearity detection via VIF and Pearson Correlation Matrix
- Polynomial regression of any order and combination of variables
- Support for unlimited number of variables and complex combinations
- Heuristic and full random search algorithms for better model discovery
- Multi-threaded processing for faster computation
- Support for weighted data
- History and ranking of models
- Option to manually expand or reduce models
- Import data from CSV, TXT, XLSX, XLS
- Access to 380+ built-in functions plus user-defined functions
- Generation of models in C/C++, Pascal and export to Python
- Copy, save, or reload results easily
- High-quality 2D plots: fitted lines, residuals, histograms
- Set your own alpha significance level
- Optimized to handle large datasets